
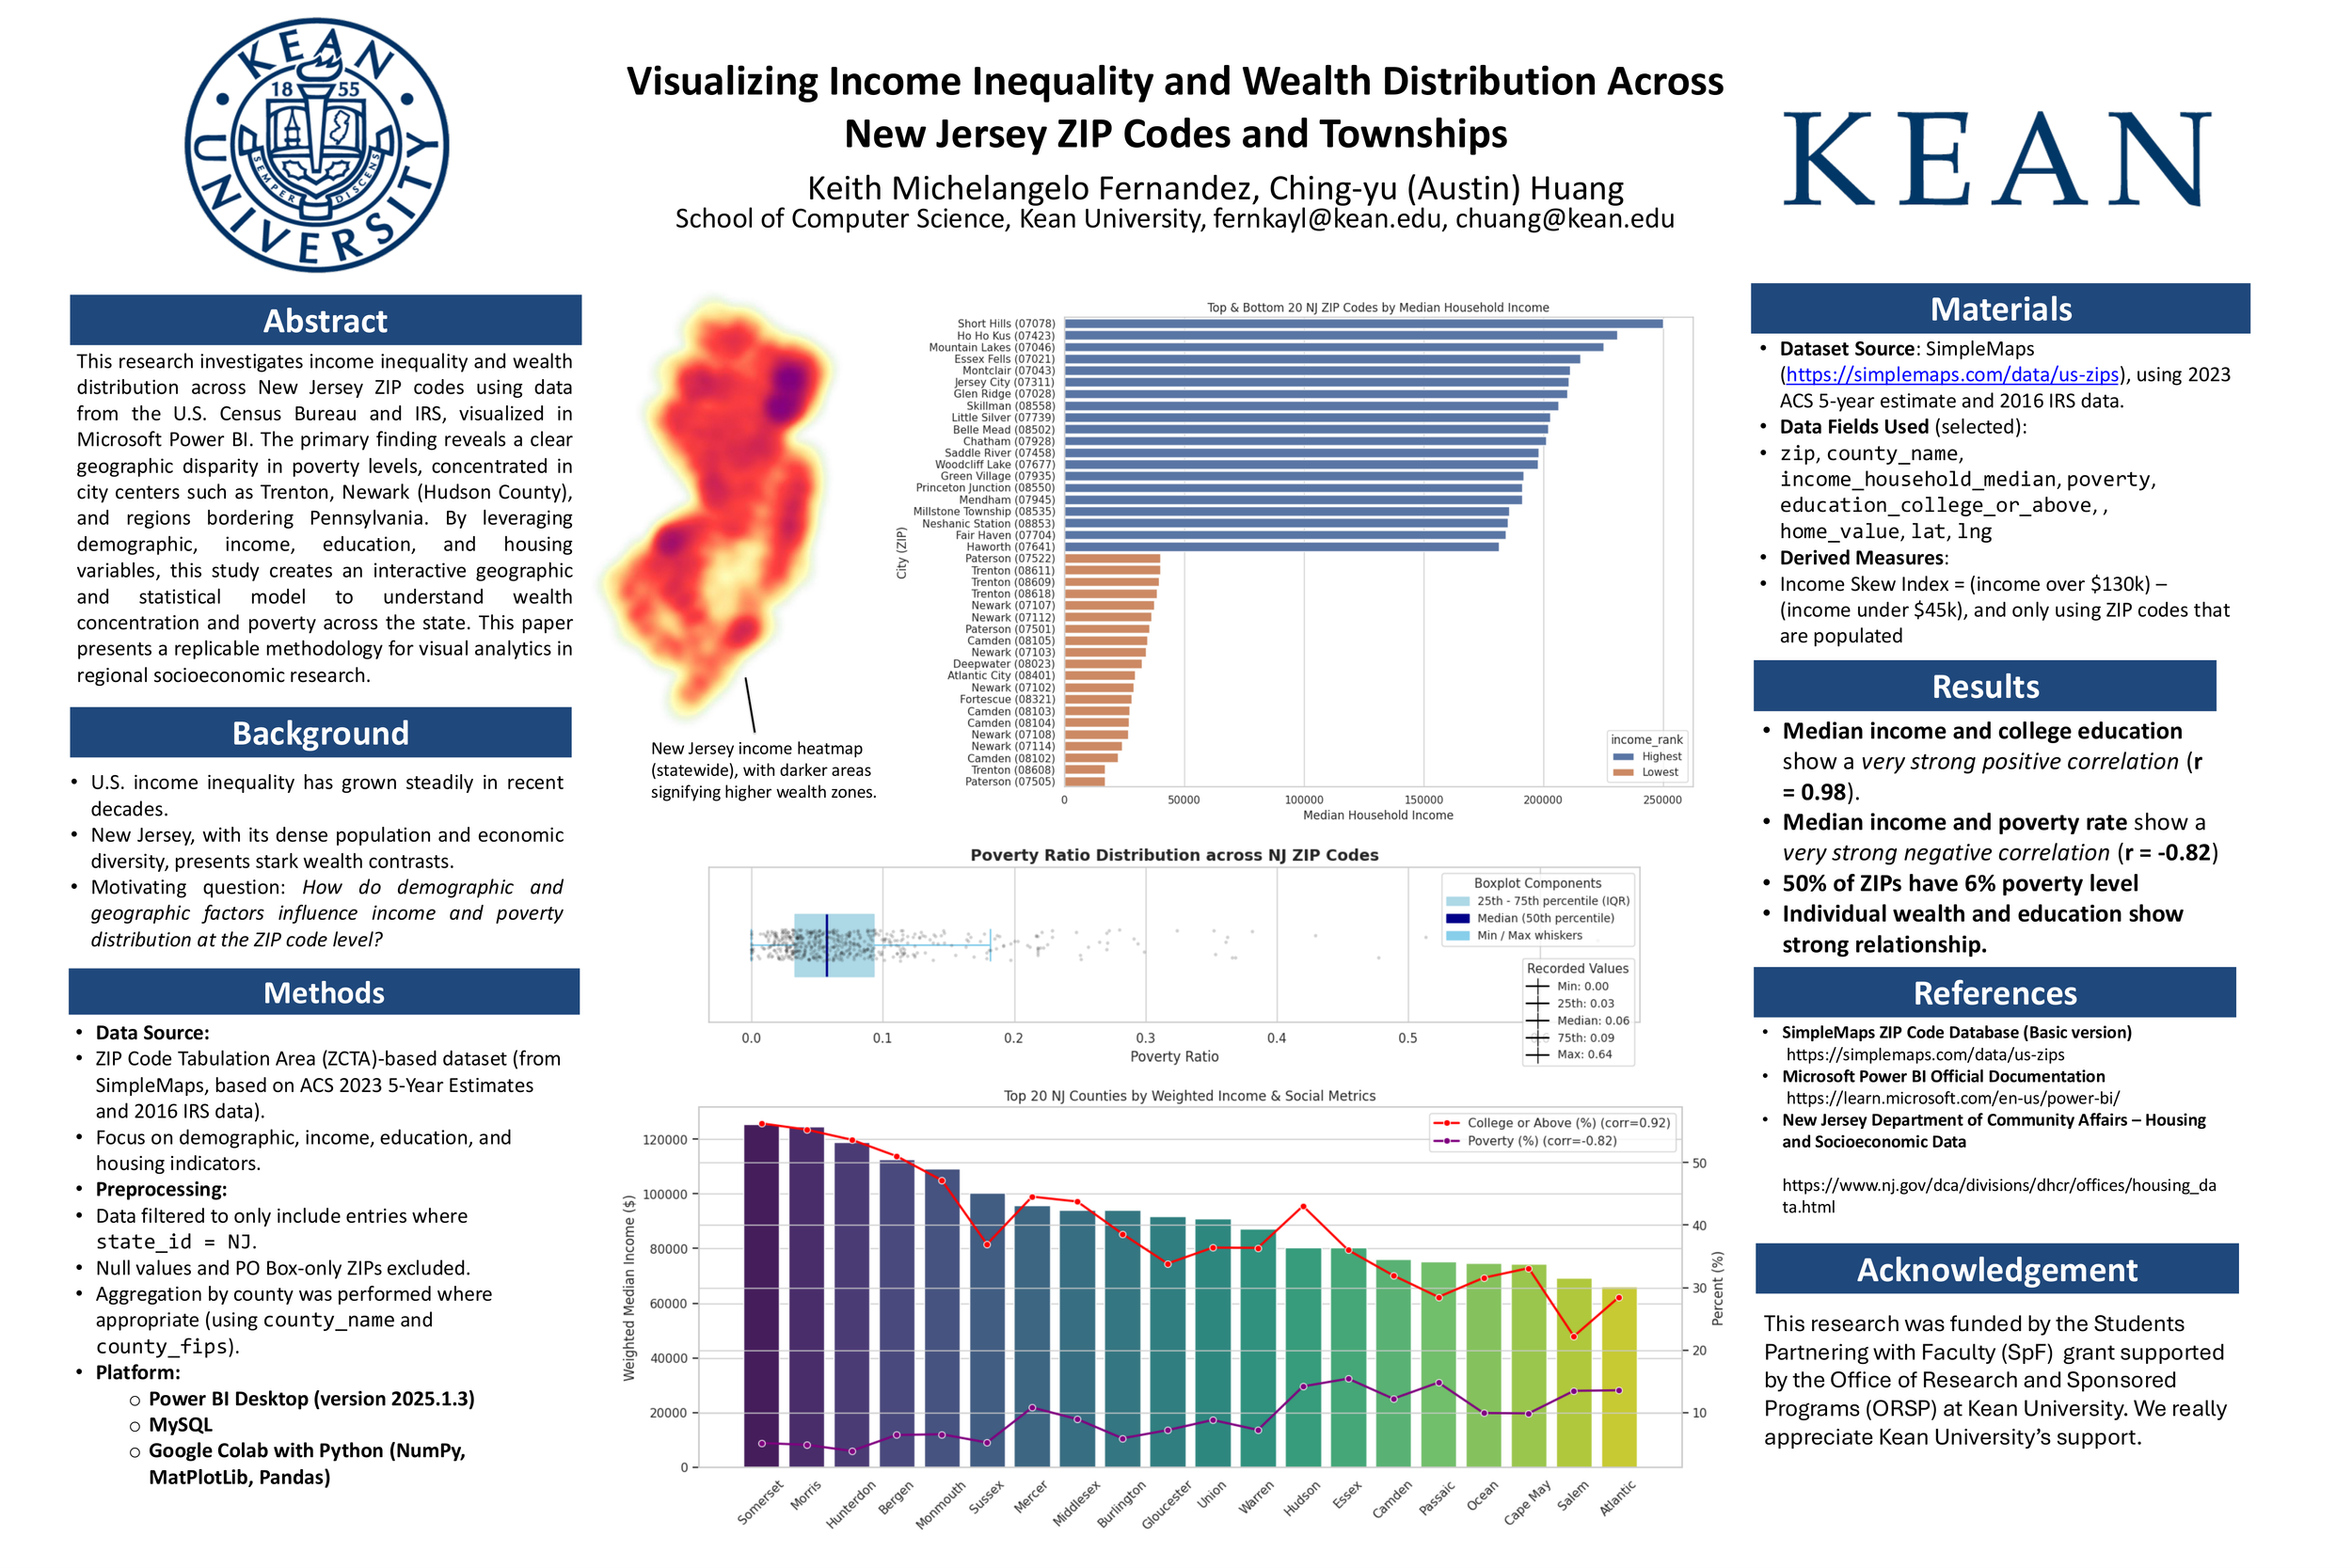
Visualizing Income Inequality and Wealth Distribution Across New Jersey ZIP Codes and Townships
Keith Fernandez
Co-Presenters: Individual Presentation
College: Hennings College of Science Mathematics and Technology
Major: BS.COMPSCI/CYBERS
Faculty Research Mentor: Ching-Yu Huang
Abstract:
Keywords: New Jersey, Census, MySQL, Power BI, Google Colab, inequality, poverty, socioeconomic visualization, socioeconomic wealth gap
This research investigates income inequality and wealth distribution across New Jersey ZIP codes using demographic and economic data from the U.S. Census Bureau and IRS, analyzed through Google Colab, MySQL, and Microsoft Power BI. The primary finding reveals pronounced geographic disparities in poverty and income, with higher concentrations in urban centers such as Newark, Trenton, and Camden, as well as along the Pennsylvania border. Using demographic, income, education, and housing variables, we developed an interactive statistical and geographic model to identify regions of concentrated poverty and relative affluence. The methodology combines data preprocessing in MySQL, transformation through Power Query, and visualization in Power BI using custom visuals such as box-and-whisker plots and choropleth maps. This replicable pipeline demonstrates the effectiveness of visual analytics in socioeconomic research, enabling policy stakeholders to identify high-risk areas and better allocate resources. By focusing on ZIP Code Tabulation Area–level data, the study highlights localized disparities often masked in county- or state-level summaries. Our results underscore the role of integrated data pipelines in bridging data accessibility and policy relevance in regional inequality research.