
US Grocery Analysis
Nicole Yeh
Co-Presenters: Individual Presentation
College: The Dorothy and George Hennings College of Science, Mathematics and Technology
Major: Computer Information Systems (M.S.)
Faculty Research Mentor: Ching-yu Huang
Abstract:
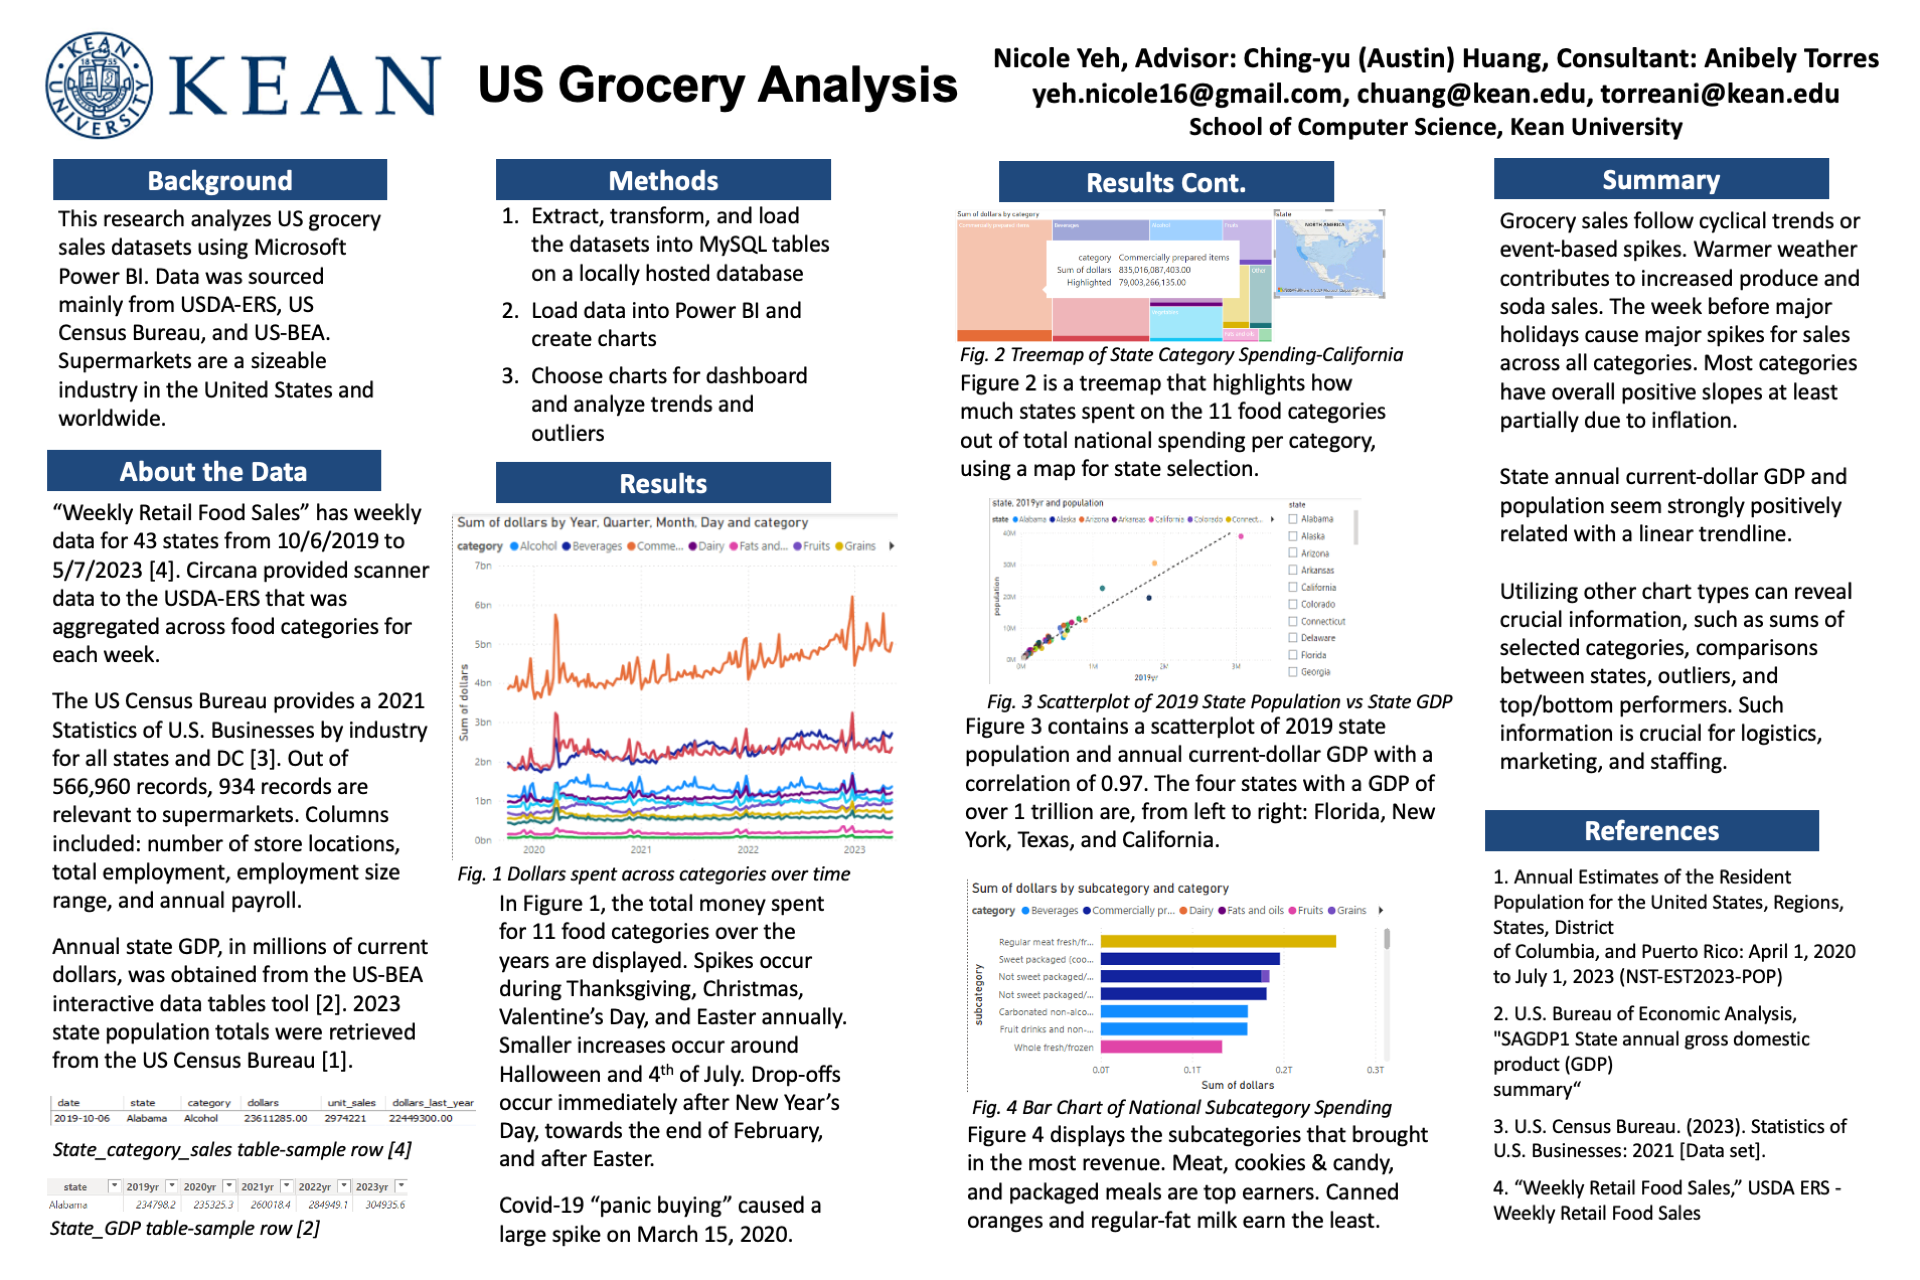
Analyzing grocery sales datasets can lead to insights into consumer trends, assistingsupermarkets with logistics so they can stock enough items and hire enough staff during busyseasons. This case study utilizes Microsoft Power BI to analyze US grocery sales data sourcedfrom the US Department of Agriculture’s Economic Research Service. Annual state grossdomestic product was sourced from the US Bureau of Economic Analysis. State information,such as unemployment rate and state population were sourced from US Census Bureau datasets.The US Census Bureau also provided a Statistics of U.S. Businesses about various enterpriseswithin all US industries. The study delves into the factors contributing to fluctuations in nationaland state sales figures, identifying the underlying causes of peaks, troughs, and outliers observedin the data. Ultimately, sales greatly increase across all categories the week before a majorholiday. Categories like “beverages” and “fruits and vegetables” fluctuate with the seasons,generating more revenue during warmer months and less revenue during colder months of the year.